


Forestry Explained – Turning Complexity Into Clarity
Forestry Explained turns ten this year, and while it has grown and evolved immensely over the past decade its core objective remains steadfast: to translate complex, often misunderstood aspects of forestry into clear, accessible stories for the general public, while still holding value for industry stakeholders.
In a landscape where perception increasingly shapes policy and investment, this matters.
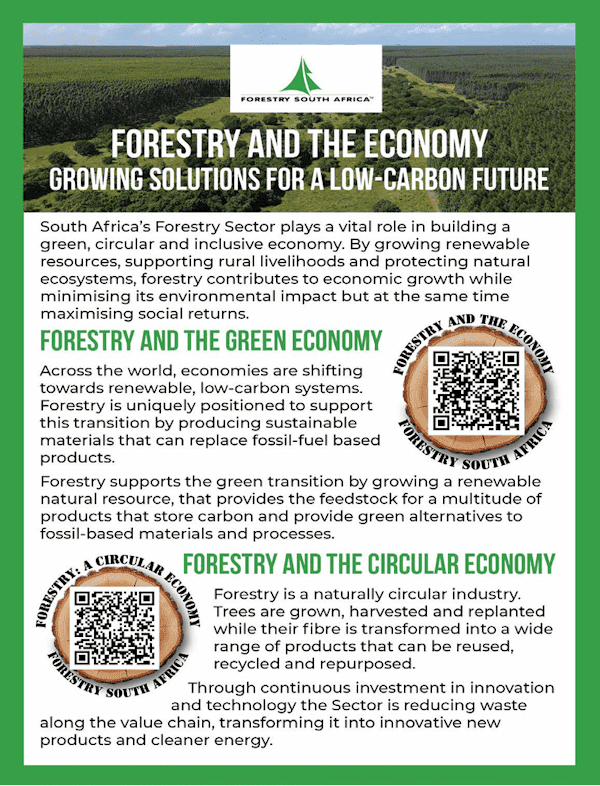
Last year, FSA started the process of updating the 30 plus Forestry Explained infographics, releasing ‘Getting to Know South Africa’s Forests’ and ‘Forestry Ownership’ both part of the Forestry Explained Guide to Forestry series. This year, the final infographic in this series ‘Introducing SA’s Planted Trees’ has just been released, alongside ‘Forestry and the Economy’, which rounds off this series. Introducing SA’s Planted Trees explains the three main tree types that underpin South Africa’s plantation forestry, namely Eucalyptus, pine and wattle, the type of wood they produce and the products made from it. The infographic includes the individual species, where they are predominantly grown and some of the site specific requirements. The second explores the Sector’s economic contribution, from job creation to its role in a low carbon, circular economy.
Why Infographics Matter Now
Public understanding of forestry is often shaped by partial information or outdated narratives. Concerns around water use, biodiversity and land use can dominate the conversation, while the Sector’s broader social and economic value is less visible.
These infographics help close that gap. They are designed to address misperceptions by presenting verified, balanced information, while highlighting both obvious and lesser known benefits of the Sector. Ultimately, they are there to provide members with credible, shareable material to counter negative sentiment and build a more informed public dialogue around forestry. By simplifying without oversimplifying, the series strengthens social acceptance of the Sector, giving forestry a clearer voice in discussions where nuance is often lost.
Communicating Value Across The Value Chain
‘Forests and the Economy’ infographic is particularly powerful in reframing how forestry is viewed.
It moves beyond the idea of trees as a single output and instead shows a dynamic value chain that supports rural livelihoods, feeds multiple industries and contributes to a greener economy.
It is about reinforcing a key message that forestry needs to be seen as a renewable resource that underpins sustainable materials, aligned with circular economy principles through reuse, recycling and innovation. It also introduces the notion that forestry and forest products could play a crucial role in reducing our reliance on fossil based products and processes, as well as contributing to rural employment and local economies.
For members, this creates a practical tool that can be used in community engagement, stakeholder discussions and advocacy work.
Explaining The Trees Behind The Industry
Introducing SA Planted Trees looks to address another common gap in public understanding regarding the tree species being used and how, through science and innovation, these are being carefully selected to suit specific climates, soils and end uses.
By explaining why these trees are grown, how they are managed and how they contribute to different products, the infographic demystifies plantation forestry. It also reinforces the message that forestry is a science driven, highly managed land use, not a one size fits all activity.
A More Engaging, Mobile First Approach
A notable evolution in FSA’s infographics is the integration of mobile friendly video content. Each infographic includes QR codes linking to short videos that unpack the detail behind the headline messages.
This layered approach works well as the text can deliver clear, quick insights while the video provides depth for those who want to explore further, with content accessible on the platforms where audiences already are.
For members, this means the material is not only informative but also highly shareable across meetings, social media and community engagement.
Looking Ahead: Tackling The Big enviromental Questions
The next phase of the Forestry Explained Infographic series will focus on environmental stewardship and three critical themes within this:
– Forests and climate change
– Forestry and biodiversity
– Forestry and water.
These topics go to the heart of current global and national debates. They also represent areas where forestry is often scrutinised. By addressing them directly, the upcoming infographics will showcase the Sector’s environmental stewardship, explain how forestry contributes to climate solutions, highlighting biodiversity preservation and management, while clarifying the relationship between forestry and water resources.
This proactive communication is essential. It positions the Sector not as a passive participant in environmental discussions, but as an active contributor to solutions.
A Practical Tool For Members
Ultimately, the value of these infographics lies in their usability.
They are not just communication products, they are tools that we hope members will use to strengthen engagement with communities and stakeholders and provide consistent, credible messaging across the Sector that promotes a more balanced understanding of forestry.
In an environment where perception can influence everything from policy to investment, clear communication is no longer optional, it is a strategic necessity. Forestry Explained is a strong step in that direction, helping ensure that the story of South African forestry is not only told, but understood.


Written By: Ronald Heath, FSA Head Of Communication
Source: Page 22 of Forestry In Focus
Back to NEWS:
BUSINESS l CLIMATE CHANGE l CONSTRUCTION l EDUCATION l ENVIRONMENT l FORESTRY ENGINEERING FORESTRY l GOVERNMENT l INTERNATIONAL l LAND l RECYCLING l RESEARCH l ROOFING l SHORT HAUL SILVICULTURE l SOCIAL RESPONSIBILITY l TRANSPORT l TREATMENT l TRANSPORT l VALUE ADDING


